Publish date: 8.12.24
When reading a bull proof or genomic evaluation, it is important to understand each trait, its definition, and the potential economic impact it can have on your operation if you select for it. In some cases, one point, plus or minus, could have minimal impacts; in others, the impact can be much greater.
Traits are calculated as predicted transmitting abilities (PTAs) and are compared to the base, or average of the breed population. The base change process recalculates the averages every five years. This adjustment ensures the average PTAs for various traits within a breed are recalibrated to a new reference population, resetting these averages to zero. This process helps maintain the accuracy and relevance of genetic evaluations over time as new data and breeding advancements occur.
The last base change was in 2020, and currently, the PTA base is from cows born in 2015. The next base change is coming soon in 2025. The PTA will be updated to reflect averages based on cows born in 2020. As dairy producers strive to progress genetically, these adjustments help reflect that genetic progress.
Quantify the Financial Impact of One Pound, Plus or Minus, for Production Traits
There are three production traits available for genetic selection: Milk, Fat, and Protein. All three traits are expressed in the expected second lactation yield in pounds compared to the breed average. Since most milk markets are paid on Fat and Protein yields rather than the volume of milk, let’s take a closer look at Fat and Protein and how they stack up.
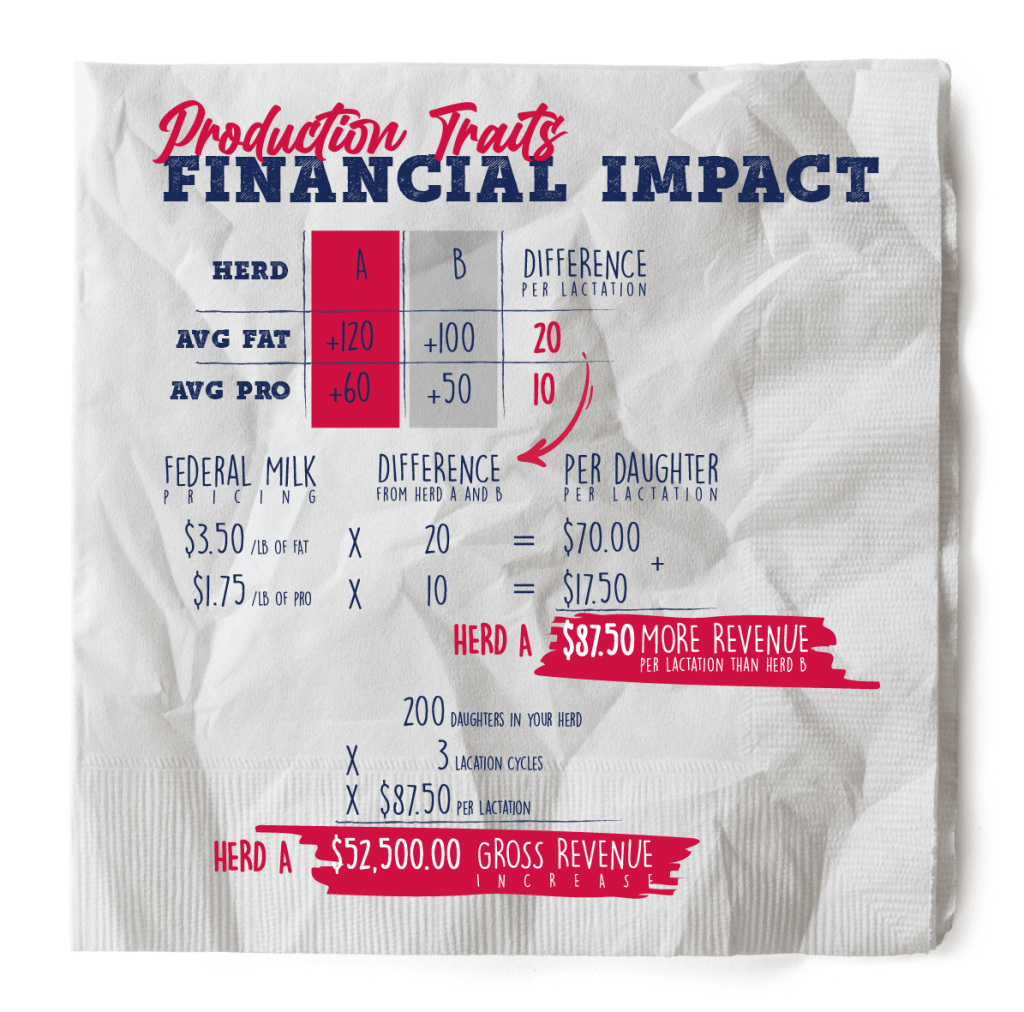
Imagine if you were comparing two groups of Holstein sires to breed to your herd. Sire Group A has an average Fat of +120 and an average Protein of +60. Sire Group B has an average Fat of +100 and an average Protein of +50.
What is the financial impact of these values?
Daughters of Sire Group A are expected to yield 20 more pounds of fat and 10 more pounds of protein per lactation compared to Sire Group B. So now, let’s add in some dollar figures and do some simple math to understand what the financial impact is of the values. In this scenario, their Federal Milk Order price is $3.50 per pound of fat and $1.75 per pound of protein.
Here is the value difference between Sire Group A and Sire Group B:

- The 20-pound difference in Fat PTA times $3.50 per pound of Fat would equal $70.00 per daughter per lactation.
- The 10-pound difference in Protein PTA times $1.75 per pound of Protein would equal $17.50 per daughter per lactation.
- Overall, the daughters of Sire Group A are expected on average to generate $87.50 MORE IN REVENUE PER LACTATION when just looking at their production traits alone.
The financial impact multiplies when factoring in multiple lactations and the number of daughters in your herd. Let’s do some quick napkin math to assess the potential impact of the decision. Take the $87.50 revenue difference times 3 lactations and 200 daughters. The math would show a $52,500 EXPECTED GROSS REVENUE INCREASE when comparing the daughters’ fat and milk production of Sire Group A to the daughters of Sire Group B.
There is a financial impact when it comes to the genetics you incorporate into your herd. Even more importantly, genetics are a permanent investment in your herd which means the impacts cumulate for generations to come. Thus, the genetics you select today will impact your future herd.
Creating a Balanced Custom Index
Because genetics impact your finances and your future herd, it is key that you understand what the ideal cow is in your system . Your milk check is unique depending on your premium structure and which Federal Order your milk is marketed in. Every dairy has unique needs and wants, making them different from the dairy down the road.
Selecting genetics based on an industry index is not a wrong choice. However, because not every dairy is like the average dairy in a particular country, an industry index can really limit the genetic progress that you make. That’s why we suggest using an ABS Custom Index.
In the case of this blog, it is important to remember that production traits are just one key part of a balanced Custom Index. Other traits like health and fitness impact your bottom line, too and will have a negative correlation to traits like production. A Custom Index allows you to choose and appropriately weigh the traits that impact your dairy’s profitability. It aims to reduce the stress that comes with genetic selection by simplifying trait selection into one single value based on your milk market, herd health, facilities, and business style.
Have no fear. Creating your Custom Index doesn’t have to be overwhelming. ABS can help you build an effective Custom Index by serving as a genetic advisor and developing a breeding plan for your specific dairy.
Interested in building your own Custom Index or ensuring you are maximizing genetic progress? Contact your ABS Genetic Advisor or complete the form below.


